Everyone knows what a Venn diagram looks like, right? A great visual representation, the Venn diagram shows the relationships between data sets or groups, commonly consisting of two or three overlapping circles.
Whether you have that business presentation where you need to showcase how your company is overspending on advertising in five locations or you need to show the similarities between two animal species for your next classroom presentation, in both cases you can use Venn diagrams to prove them.
Learn how to make Venn diagrams easily and visualize your data and concepts with ClickCharts Venn Diagram maker software.
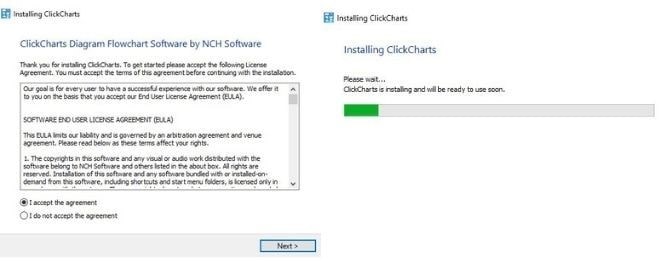
Download ClickCharts Venn Diagram Maker. Follow the instructions to install ClickCharts and launch the program on your computer to begin creating.
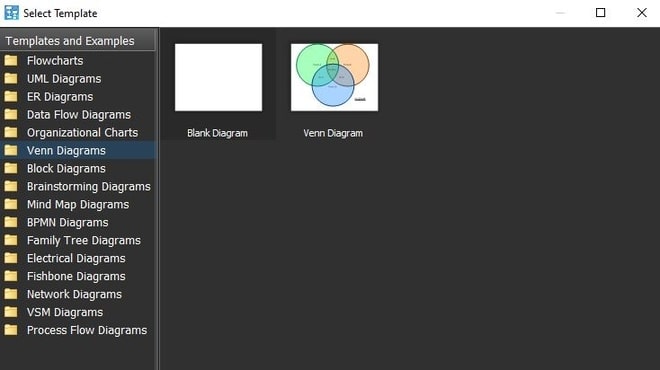
2. Select Venn Diagram Template
Select Create New option from the ClickCharts welcome dialogue. From the templates and examples menu, select Venn Diagram.
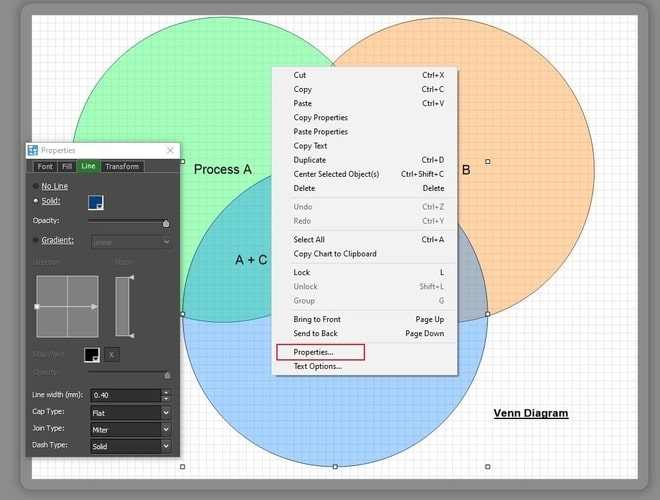
3. Edit Venn Diagram Design
Right-click the Venn Diagram circles and select Properties to edit the diagram color fill, outlines, font and font sizes, and more.
If you would like to compare only two categories in your Venn diagram, click the third circle, and click Delete from the Edit tab in the main toolbar.
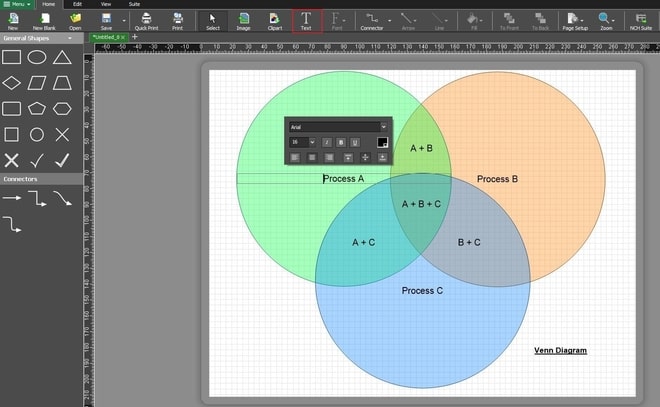
4. Add Text to Venn Diagram
Double click on any text area to edit the text. You can also change the font settings from the pop-up.
To add new text fields to the Venn diagram, click the Text button from the main toolbar and click where you would like to add the text box. You can also drag and drop the text fields around the diagram.
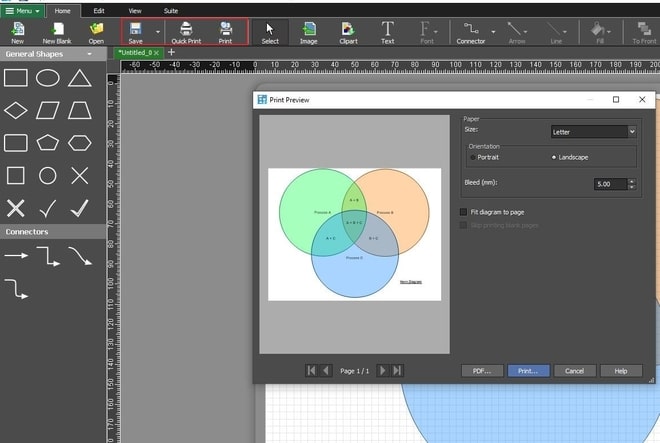
5. Export or Print Venn Diagram
Click the Save button to save the Venn diagram as a PDF or an image. To print the Venn diagram, click the Print button and adjust the print settings as necessary and select Print.
And there you have it, you have successfully learned how to make a Venn diagram. The final step is to present your professional Venn diagram chart and earn all the plaudits! Download ClickCharts and start creating Venn diagrams and other charts right away!